
Learn how to confidently read candlestick charts with this guide to 16 powerful patterns every trader should know. Perfect for beginners and pros seeking profitable trading strategies.
Candlestick patterns are one of the most powerful tools in a trader’s technical analysis arsenal. By observing how prices behave over time, candlestick charts help traders understand market psychology and anticipate potential price movements. In this guide, we’ll explore 16 of the most important candlestick patterns you should know — complete with explanations and visual references.
🔍 What Is a Candlestick?
A candlestick represents price movement over a specific time period, such as one minute, one hour, or one day. On a daily chart, each candlestick reflects one full day of price action.
Each candlestick has three key parts:
- 🟥 The Body – The difference between the open and close prices
- 🟪 The Shadows (Wicks) – The highest and lowest points during the trading period
- 🟩 Color – Indicates direction: green/white for price increase (bullish), red/black for price decrease (bearish)
🧭 How to Read a Candlestick
A single candlestick captures four key price levels:
- Open – Where the price started
- Close – Where the price ended
- High – The highest price during the session
- Low – The lowest price during the session
The color of the candle shows sentiment:
✅ Bullish candle – Closes above the open
❌ Bearish candle – Closes below the open
📈 Bullish Candlestick Patterns
These patterns usually appear after a downtrend, suggesting a possible price reversal to the upside.
1. 🔨 Hammer
Image Prompt: Small green/red body with a long lower shadow
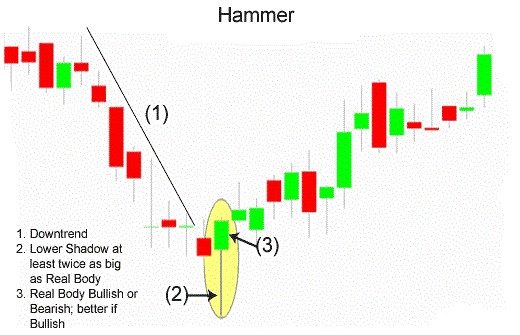
- Appears at the bottom of a downtrend
- Indicates buyers are gaining control
- Confirmation needed with a green candle the next day
2. 🔁 Inverted Hammer
Image Prompt: Small body with a long upper shadow
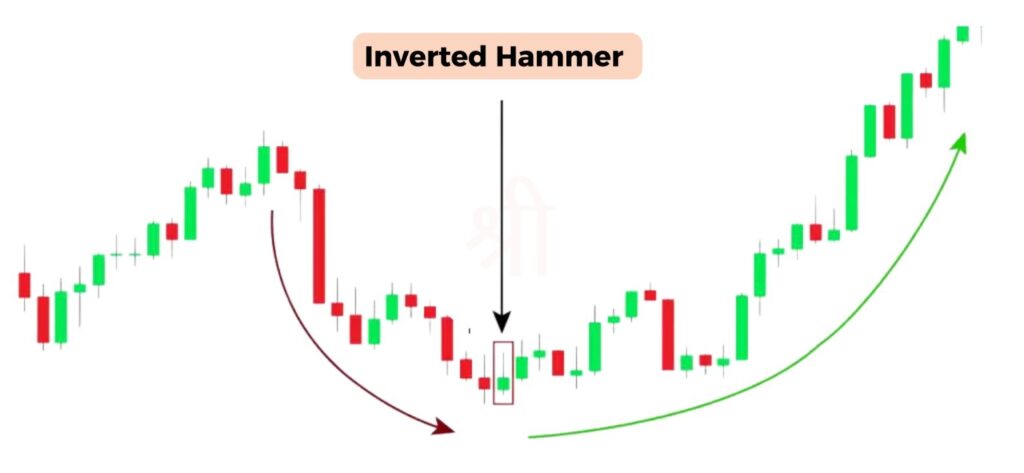
- Also occurs at the end of a downtrend
- Suggests potential bullish reversal
- Needs bullish confirmation on the next candle
3. 🟩 Bullish Engulfing
Image Prompt: Small red candle followed by a large green candle that “engulfs” it
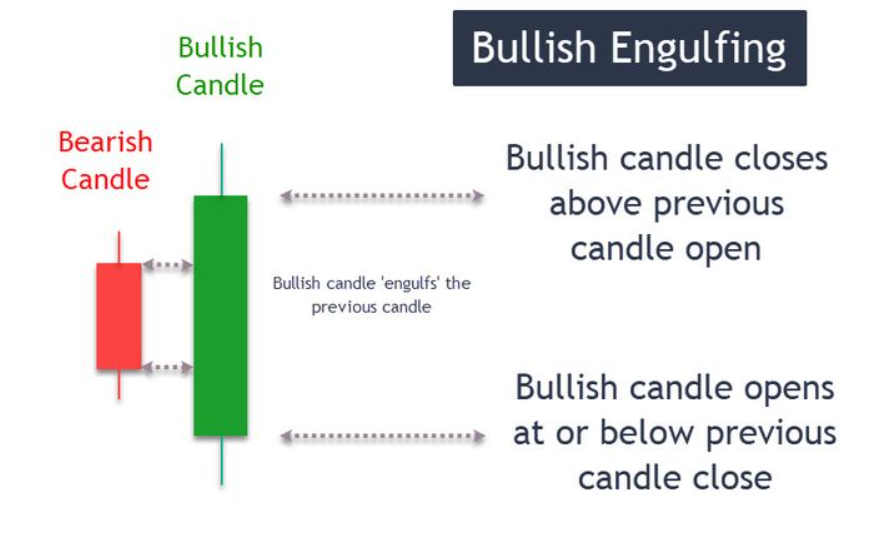
- Strong reversal signal
- Indicates a surge in buying pressure
4. 📊 Piercing Line
Image Prompt: Red candle followed by a green candle that closes above 50% of the red body

- Shows strong buyer interest
- Usually occurs after a gap down
5. 🌅 Morning Star
Image Prompt: Red candle → small-bodied candle (gap down) → green candle
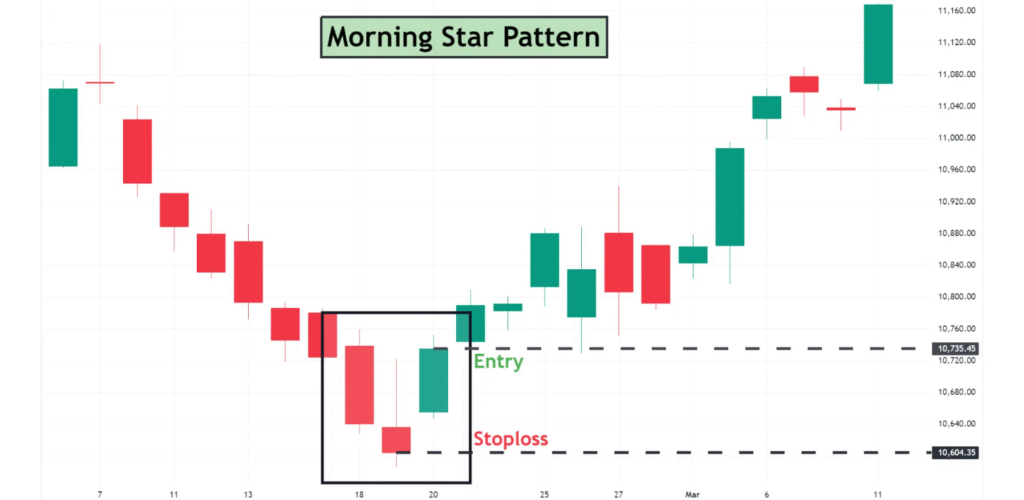
- A 3-candle pattern signaling bullish reversal
- Ideal during heavy downtrends
6. 👬 Three White Soldiers
Image Prompt: Three consecutive long green candles

- Each opens within the previous body and closes higher
- Strong signal of sustained bullish momentum
📉 Bearish Candlestick Patterns
These patterns typically emerge after an uptrend, hinting at a potential downward reversal.
7. 🪓 Hanging Man
Image Prompt: Small body with a long lower shadow
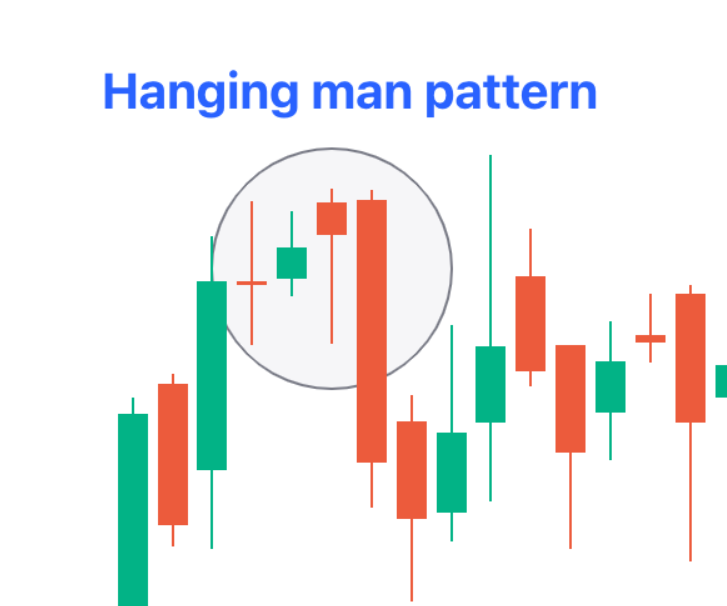
- Resembles a hammer but appears at the top of an uptrend
- Signals weakening bullish momentum
8. 🌠 Shooting Star
Image Prompt: Small body at the bottom, long upper shadow
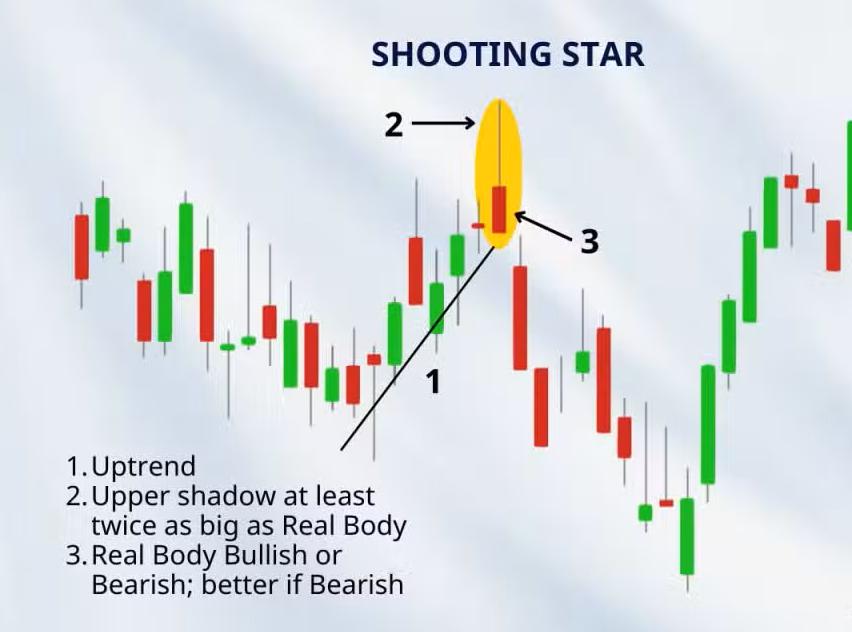
- Occurs after a price rally
- Implies a potential bearish reversal
9. 🟥 Bearish Engulfing
Image Prompt: Small green candle followed by a large red candle
- Strong indication that sellers have taken control
- Reliable after a bullish run-up
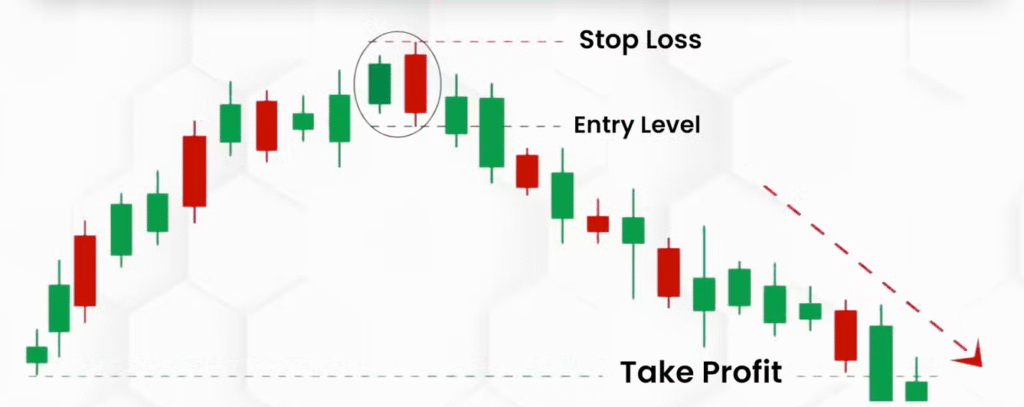
10. 🌃 Evening Star
Image Prompt: Green candle → small candle → red candle
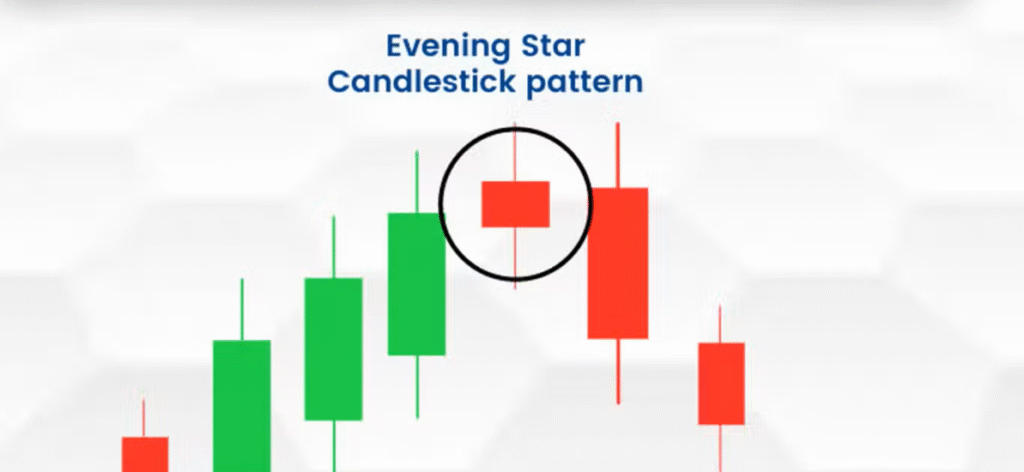
- Opposite of Morning Star
- Signals bullish exhaustion and possible trend reversal
11. 🐦 Three Black Crows
Image Prompt: Three consecutive red candles with lower closes each day
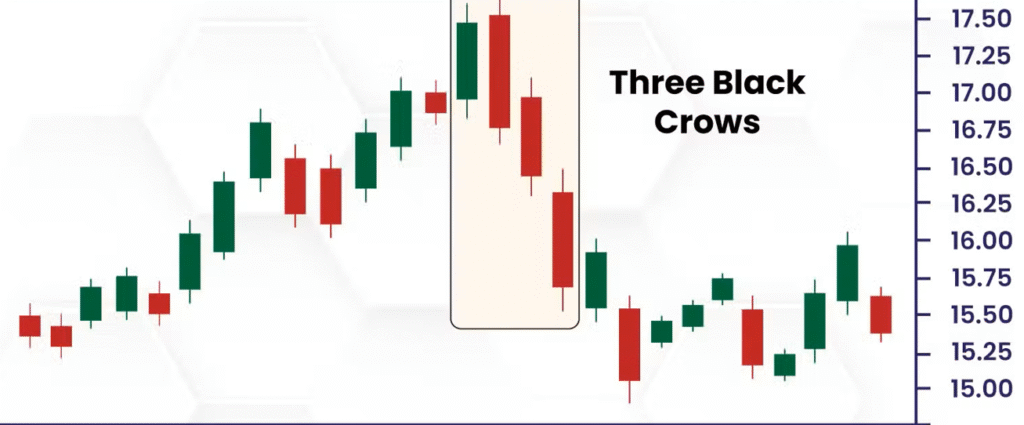
- Confirms a strong bearish trend
- Indicates sellers have overpowered buyers
12. ☁️ Dark Cloud Cover
Image Prompt: Green candle followed by red candle that opens above and closes below the midpoint of green

- Signals shift from bullish to bearish control
- The deeper the red candle, the stronger the reversal signal
🔄 Continuation Candlestick Patterns
These patterns signal pause or continuation in the existing market trend rather than reversal.
13. ➕ Doji
Image Prompt: Cross-like candle with little or no real body

- Indicates indecision in the market
- Alone it’s neutral but can add meaning to reversal setups
14. 🔄 Spinning Top
Image Prompt: Small real body centered between long upper and lower shadows
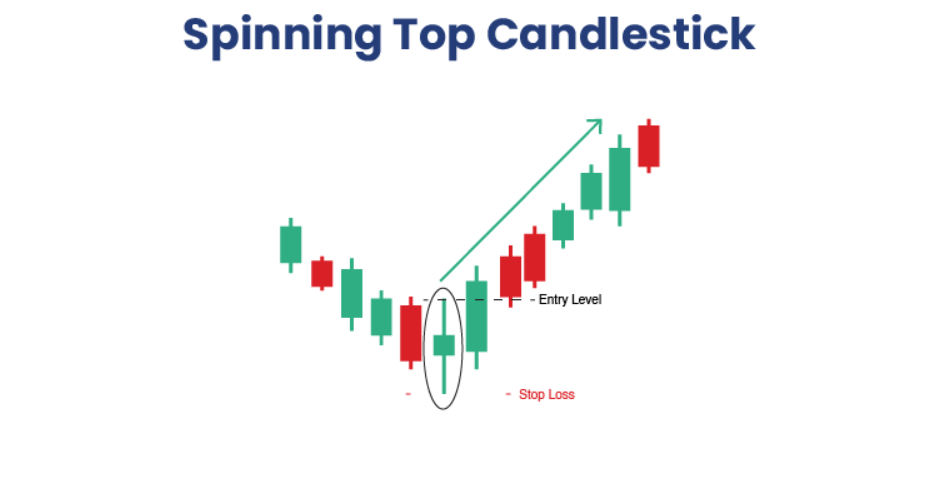
- Suggests consolidation
- Often seen before a breakout or after strong trends
15. 📉 Falling Three Methods
Image Prompt: Red candle → three small green candles → red candle
- Indicates a temporary pause in a bearish trend
- Confirms bears still control the market
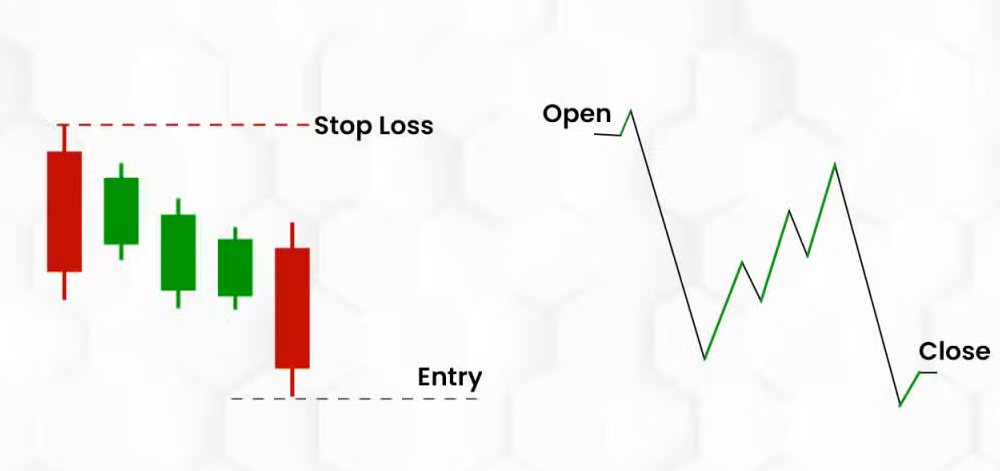
16. 📈 Rising Three Methods
Image Prompt: Green candle → three small red candles → green candle
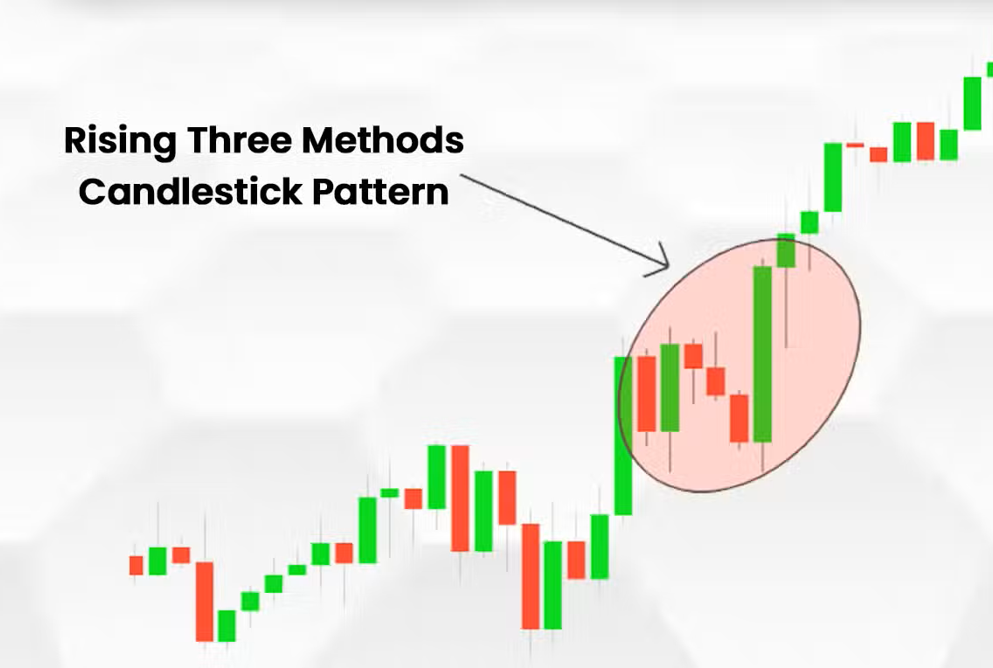
- Indicates a temporary dip in an overall bullish trend
- Buyers remain in control
📚 Summary Table
| Pattern Name | Type | Key Signal | No. of Candles |
|---|---|---|---|
| Hammer | Bullish | Reversal after downtrend | 1 |
| Inverted Hammer | Bullish | Potential reversal | 1 |
| Bullish Engulfing | Bullish | Strong reversal | 2 |
| Piercing Line | Bullish | Midpoint breakout | 2 |
| Morning Star | Bullish | Hope in downtrend | 3 |
| Three White Soldiers | Bullish | Momentum confirmation | 3 |
| Hanging Man | Bearish | Exhaustion after uptrend | 1 |
| Shooting Star | Bearish | Potential top | 1 |
| Bearish Engulfing | Bearish | Downtrend start | 2 |
| Evening Star | Bearish | Reversal after rally | 3 |
| Three Black Crows | Bearish | Bearish strength | 3 |
| Dark Cloud Cover | Bearish | Bearish takeover | 2 |
| Doji | Neutral | Indecision | 1 |
| Spinning Top | Neutral | Consolidation | 1 |
| Falling Three Methods | Bearish | Trend continuation | 5 |
| Rising Three Methods | Bullish | Trend continuation | 5 |
Mastering these 16 candlestick patterns can significantly boost your trading analysis and strategy. Whether you’re trading forex, stocks, or crypto, candlestick formations provide key insights into market psychology and momentum shifts.
Candlestick patterns are more than just chart visuals—they are the language of price action, offering powerful insights into market sentiment, trend reversals, and continuation signals. By learning these 16 essential candlestick patterns, you equip yourself with a valuable tool to make more informed, confident, and strategic trading decisions.
Whether you’re trading stocks, forex, or crypto, understanding these patterns can help you anticipate market moves, manage risk better, and seize profitable opportunities. Combine candlestick analysis with other technical indicators for even stronger confirmation—and watch your trading skills grow to the next level.
Keep learning, keep practicing, and let the charts guide your success. Happy trading! 📈💹
📝 Pro Tip: Always combine candlestick analysis with volume indicators, trendlines, and moving averages for stronger confirmation.
Also Read :
XRP Explodes 30% This Week — Is This the Exciting Beginning of a Major Crypto Bull Run?
Unlocking the Secrets of Breakout Stocks with Technical Analysis
Pizza Hut’s $2 Pan Pizza Deal Extended – Don’t Miss This Tasty Bargain